
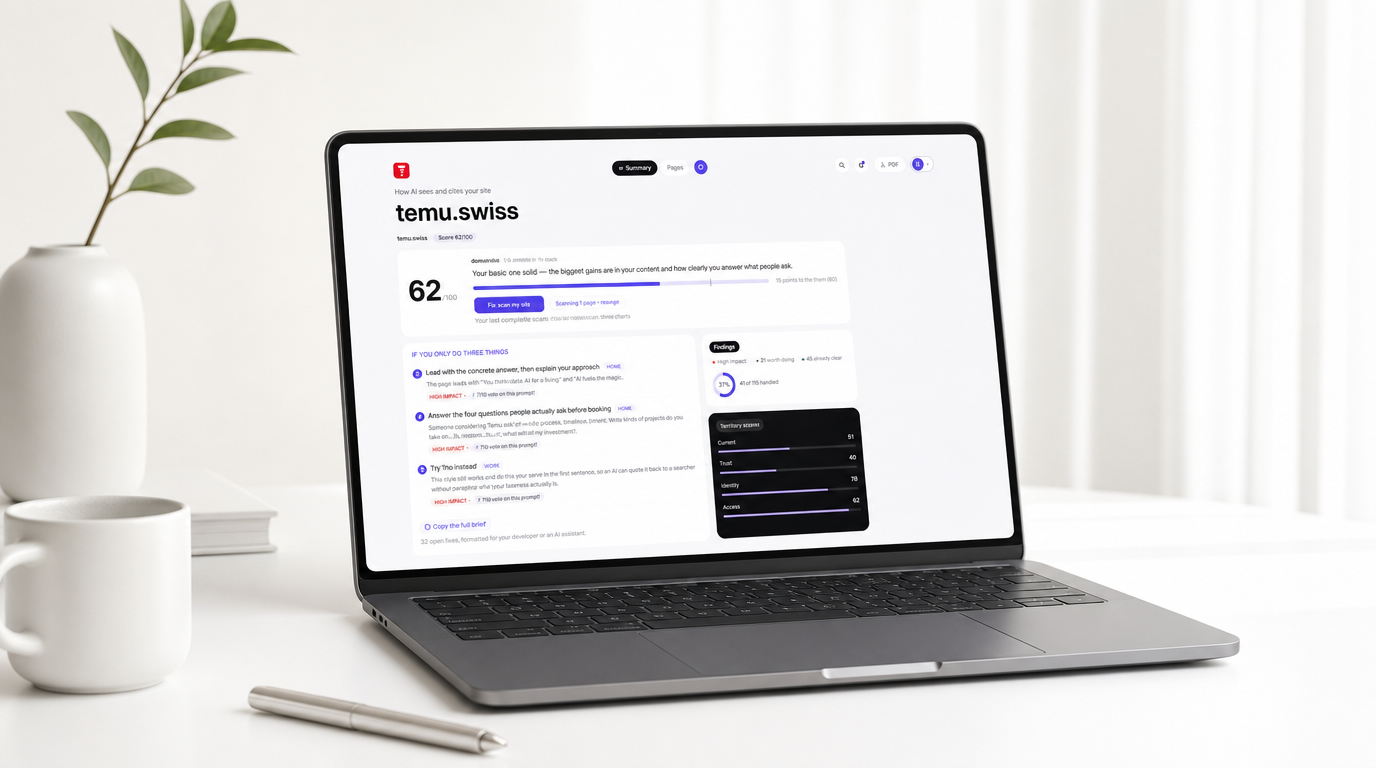
Limen has one job: show you your website the way an AI assistant reads it, then tell you, in plain words, what to change. The reading is done by an agent we call Janus. He looks at your site twice, once the way a visitor would (your paragraphs, your headings, your promises) and once the way a machine would (your metadata, your structured data, the bones under the paint). The dashboard is where he files his report.
This is a walk through that dashboard, using a real account and a real site: our own, temu.swiss. We could have picked a flattering example. We didn't, and you'll see why that matters in a moment.
One number, and a small line at 80
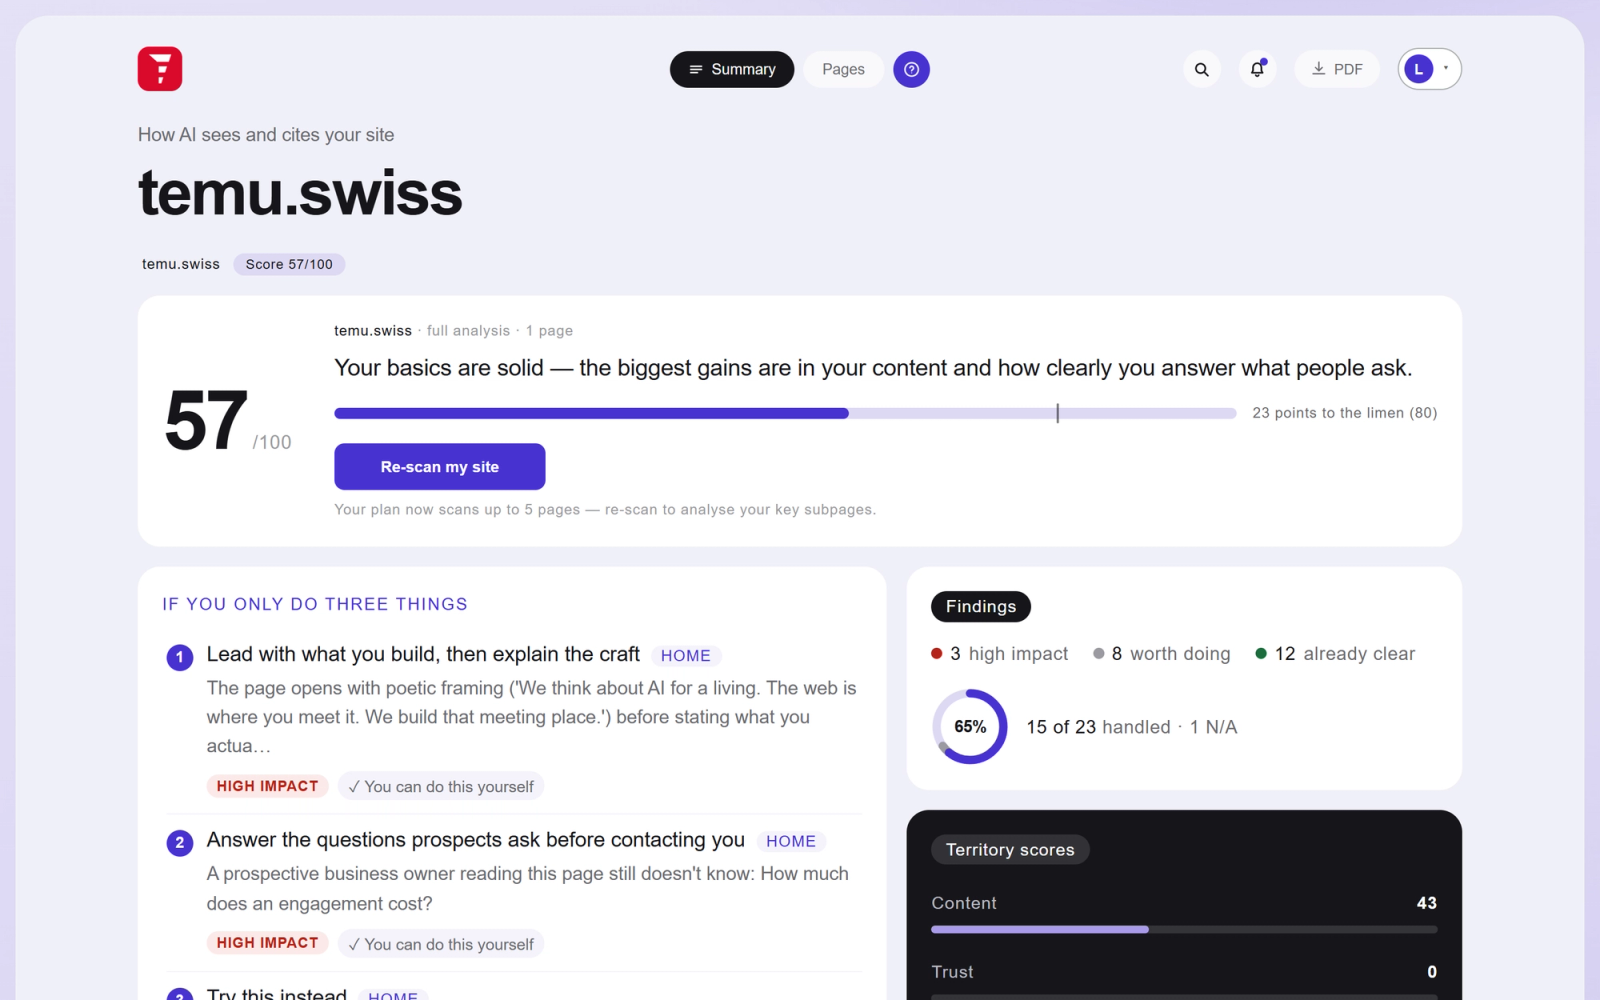
The first thing on the Summary tab is a score out of 100. Every check Janus runs carries a weight; the checks you pass earn theirs, and the score is simply the share you've earned. temu.swiss sits at 57, and under the big number a bar runs toward a small vertical tick at 80.
That tick is the limen, the threshold the product is named after. It's the level at which, in our scans, sites stop being paraphrased vaguely by AI assistants and start being quoted, cited and named. The line next to the bar does the arithmetic for you: 23 points to go. There's no grade inflation here and no red-alert theatre either. A number, a threshold, a distance.

Under the bar sits a re-scan button. A paid account can re-scan once every 24 hours and cover up to five pages, and a small "Manage pages" panel lets you choose which of your subpages ride along on the next scan. The idea is a rhythm: change something, scan again tomorrow, watch the number move.
Three things, not thirty
Most audit tools hand you a backlog and wish you luck. The priorities tile takes the opposite bet. It's titled "If you only do three things", and it means it: three findings, chosen by impact, each with the page it lives on, a one-sentence reason, and a label telling you whether you can handle it yourself. Click one and the dashboard jumps straight to that finding, opened, on the right page.
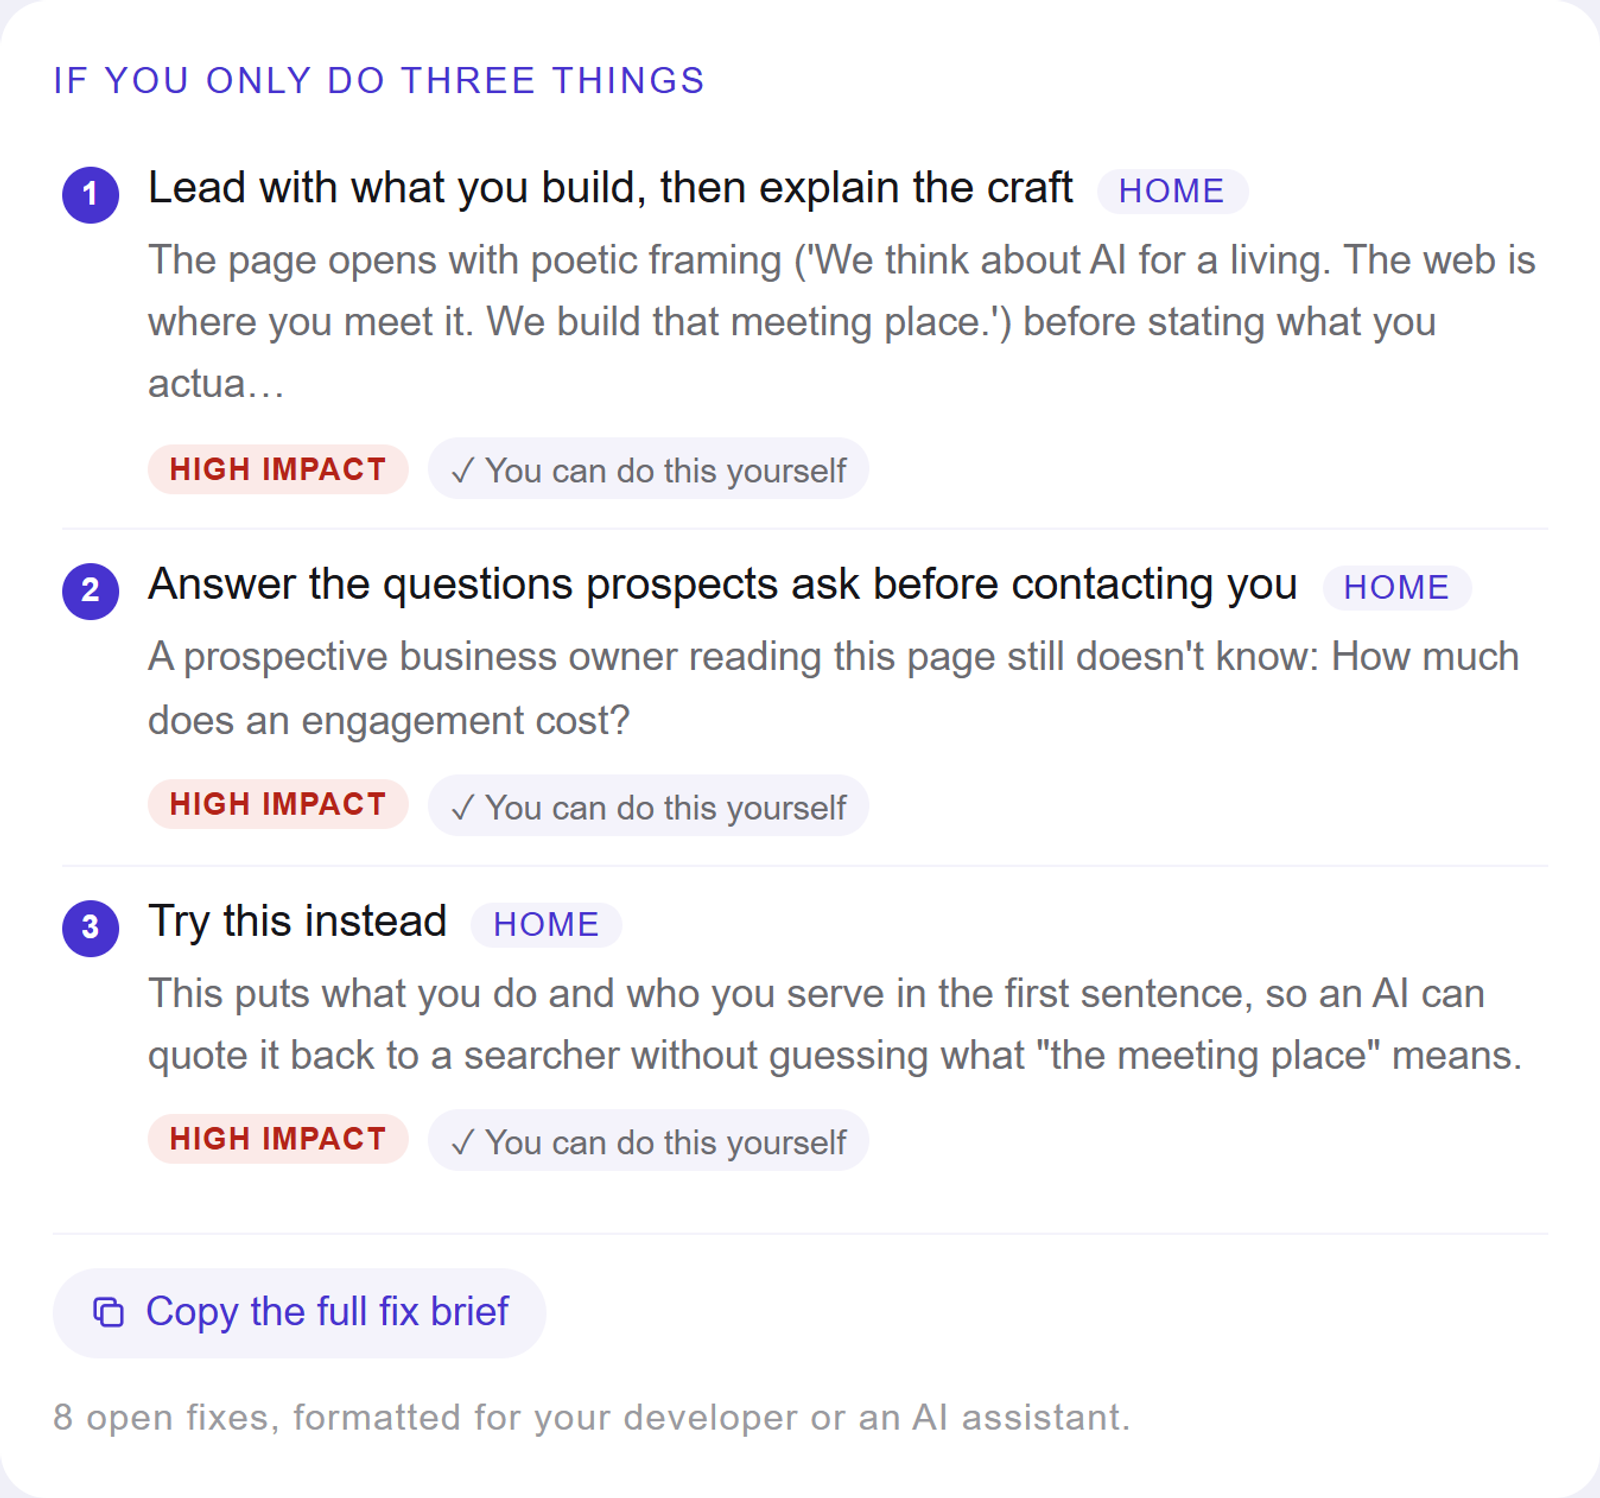
The button underneath deserves a sentence of its own. "Copy the full fix brief" assembles every open fix on your site into a single markdown document, grouped by page and ordered by impact. You can hand it to your developer, or paste it into Claude or whatever assistant you work with, and say "do this". We think of it as the dashboard's escape hatch: everything Janus knows, portable, in a format machines and contractors both read happily.
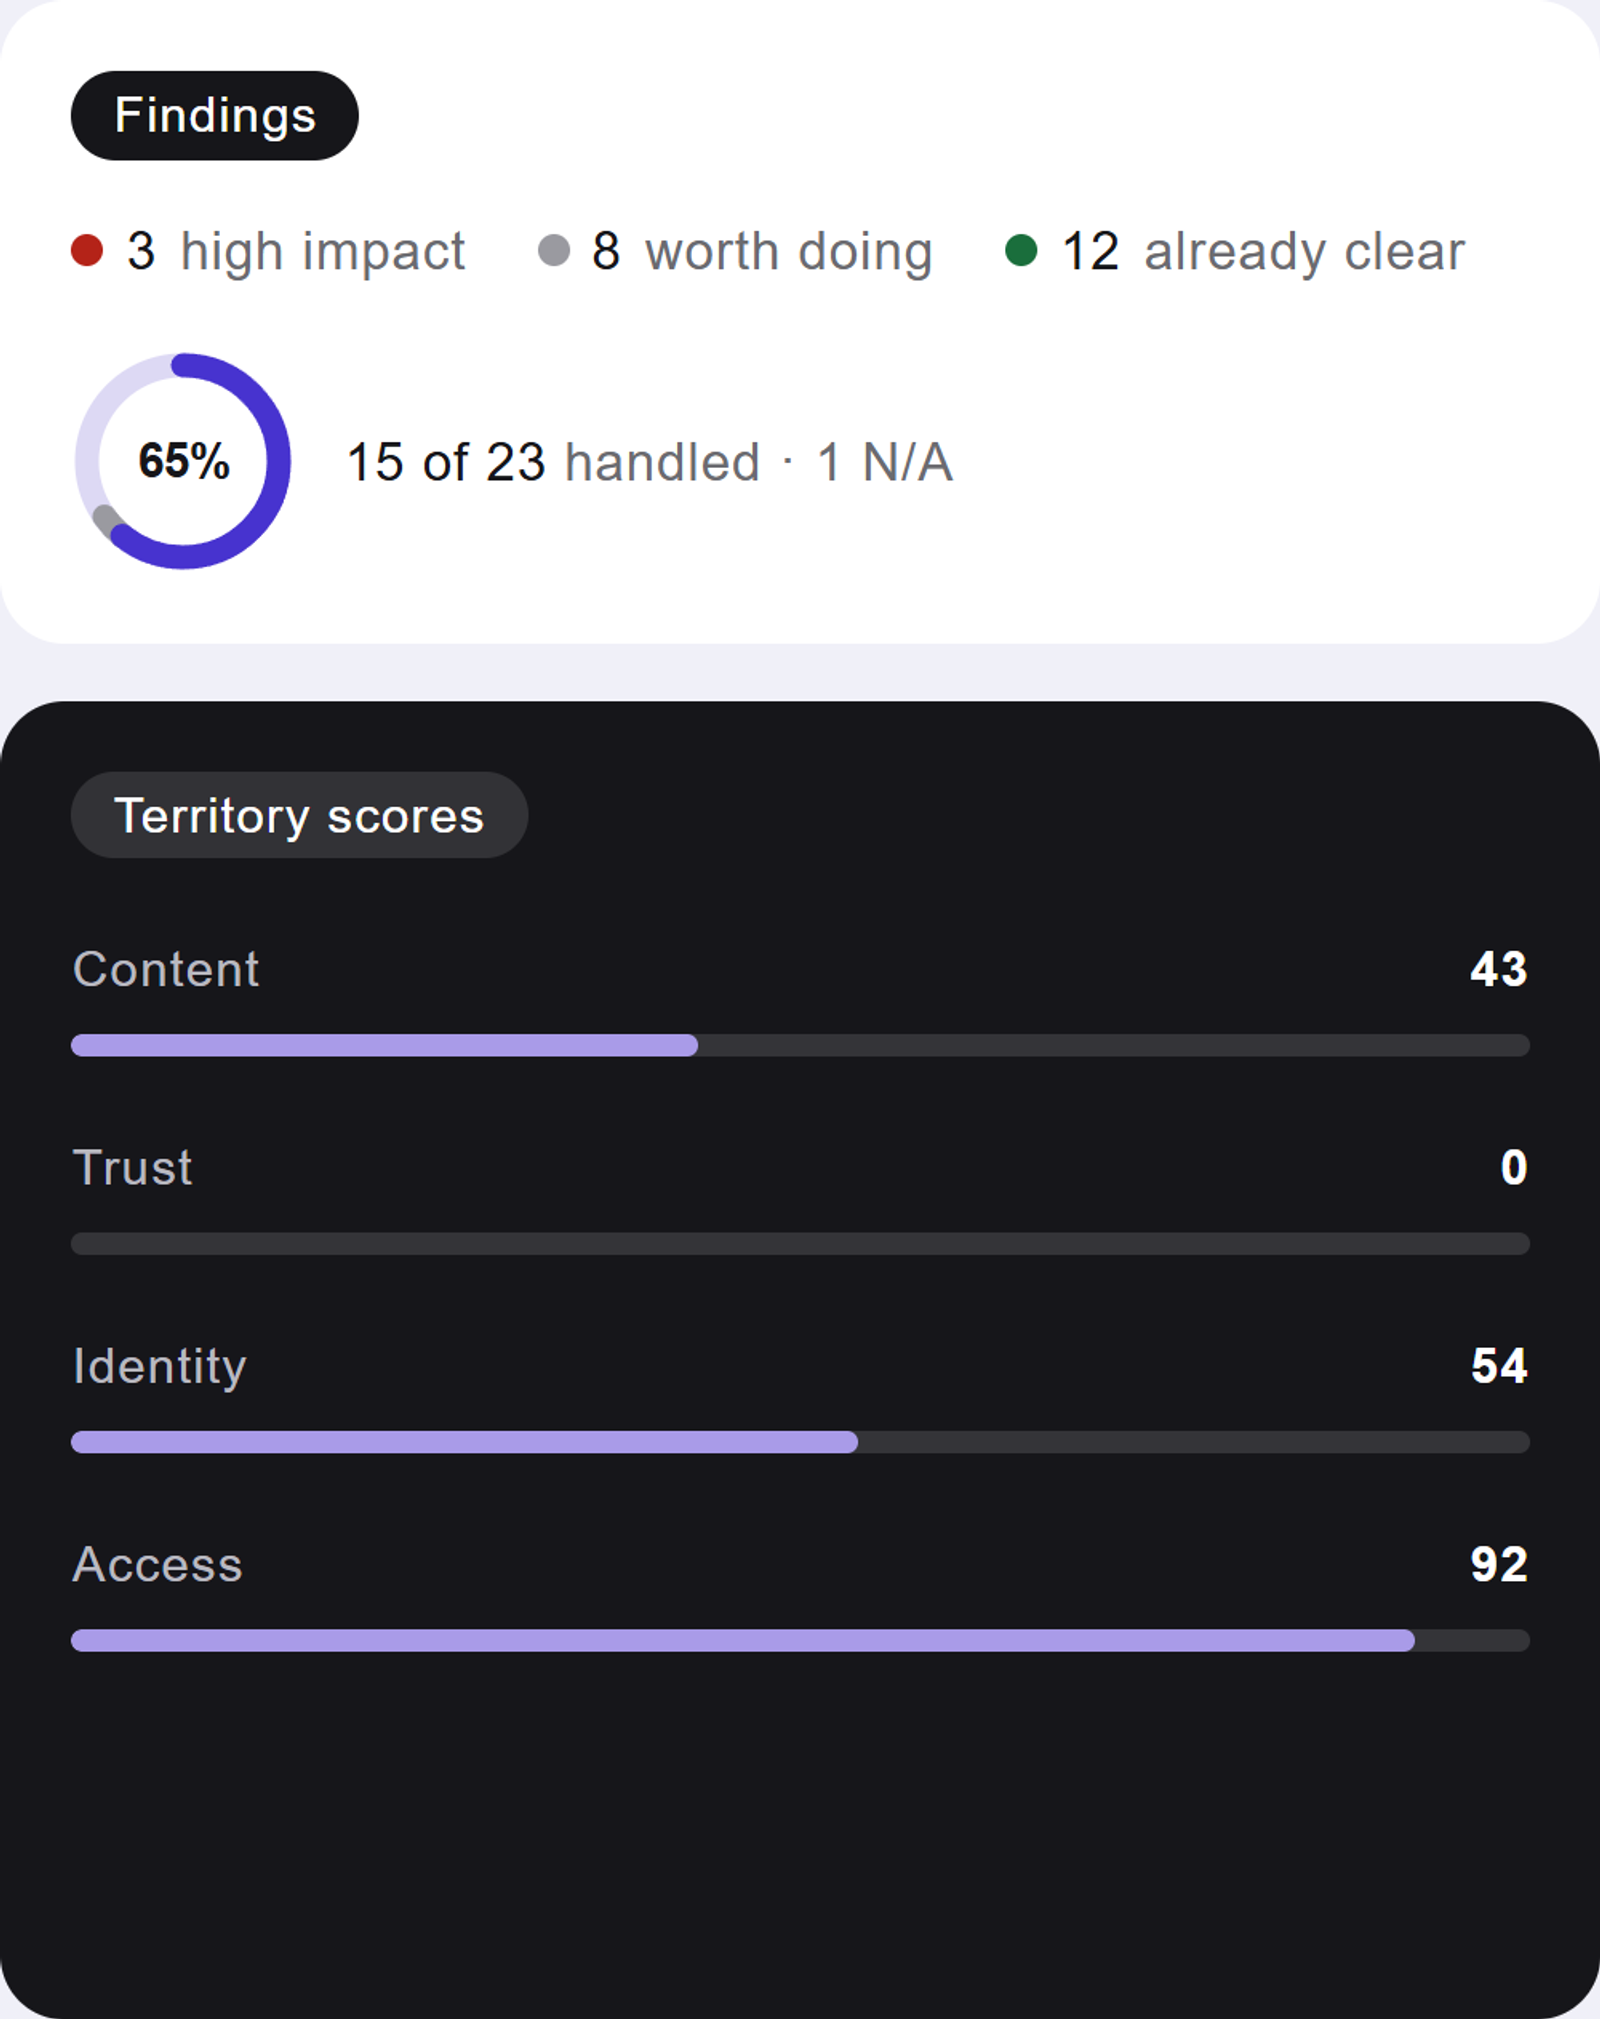
To the right of the priorities, a tally keeps the honest count: for temu.swiss, 3 findings with high impact, 8 worth doing, 12 already clear, with a progress ring showing how much of the list has been handled. Below that, the four territory scores. Every check belongs to a territory (Content, Trust, Identity, Access), and each territory gets its own number. Ours reads Content 43, Trust 0, Identity 54, Access 92. Yes, Trust at zero. Our homepage never says who is behind the work, and no amount of clean markup compensates for that. The dashboard doesn't spare its makers, which is exactly what we'd want you to take from this screenshot.
The Pages tab, where the work lives
Summary is for understanding; Pages is for doing. The left sidebar filters the full list of findings two ways: by page (Home, Site-wide, and any subpages you've added to the scan) and by state (High impact, Worth doing, Clear). Each filter shows its count, so you always know the size of what you're looking at.
Findings are grouped by territory, and each territory leads with the question it exists to answer. Content asks: can AI read, extract, and want to cite what you say? A finding you've handled greys out and keeps its checkmark, so the list doubles as a record of what you've already done.
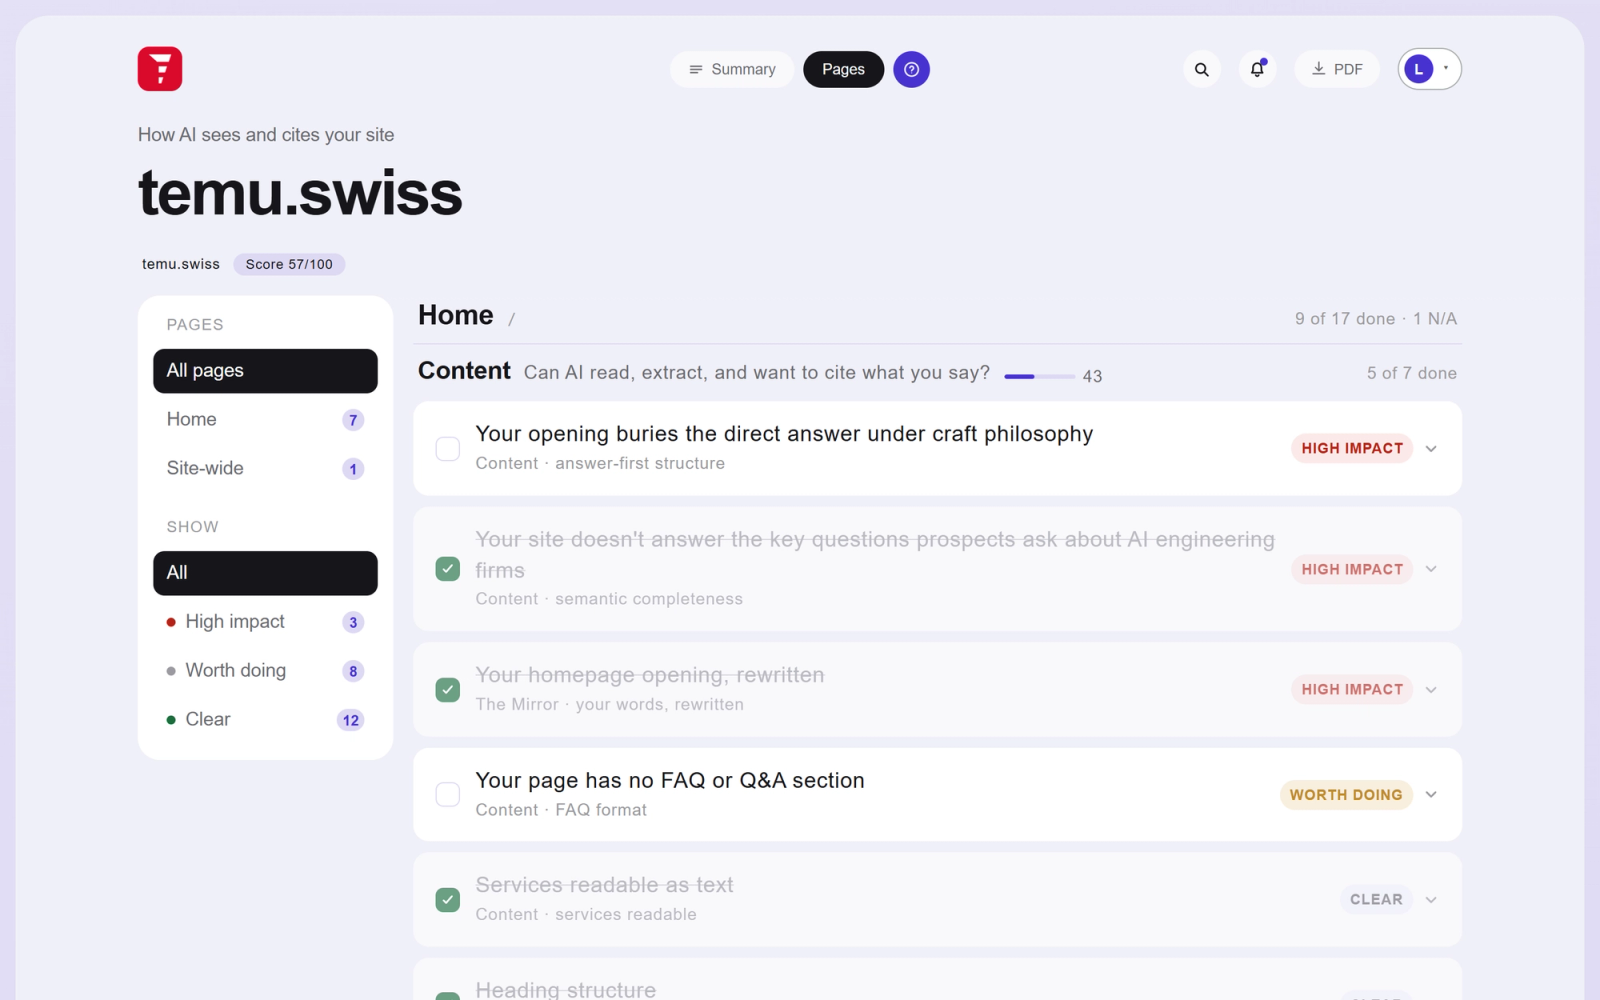
Anatomy of a single finding
Open any finding and it follows the same shape. First the why: a diagnosis written from your actual page text, in sentences, without a single acronym you'd have to look up. Then the where: the exact spot on your page it concerns, with a small screenshot you can click to see the location marked on a capture of your real page. Then the fix.
Fixes come in three kinds, and each carries its label. Some say "you can do this yourself" and give numbered steps written for a non-technical site owner. Some say the code has been written for you; those end in a code block with a Copy button, ready to paste. And some are honest enough to say "needs a developer", because pretending otherwise wastes your afternoon.
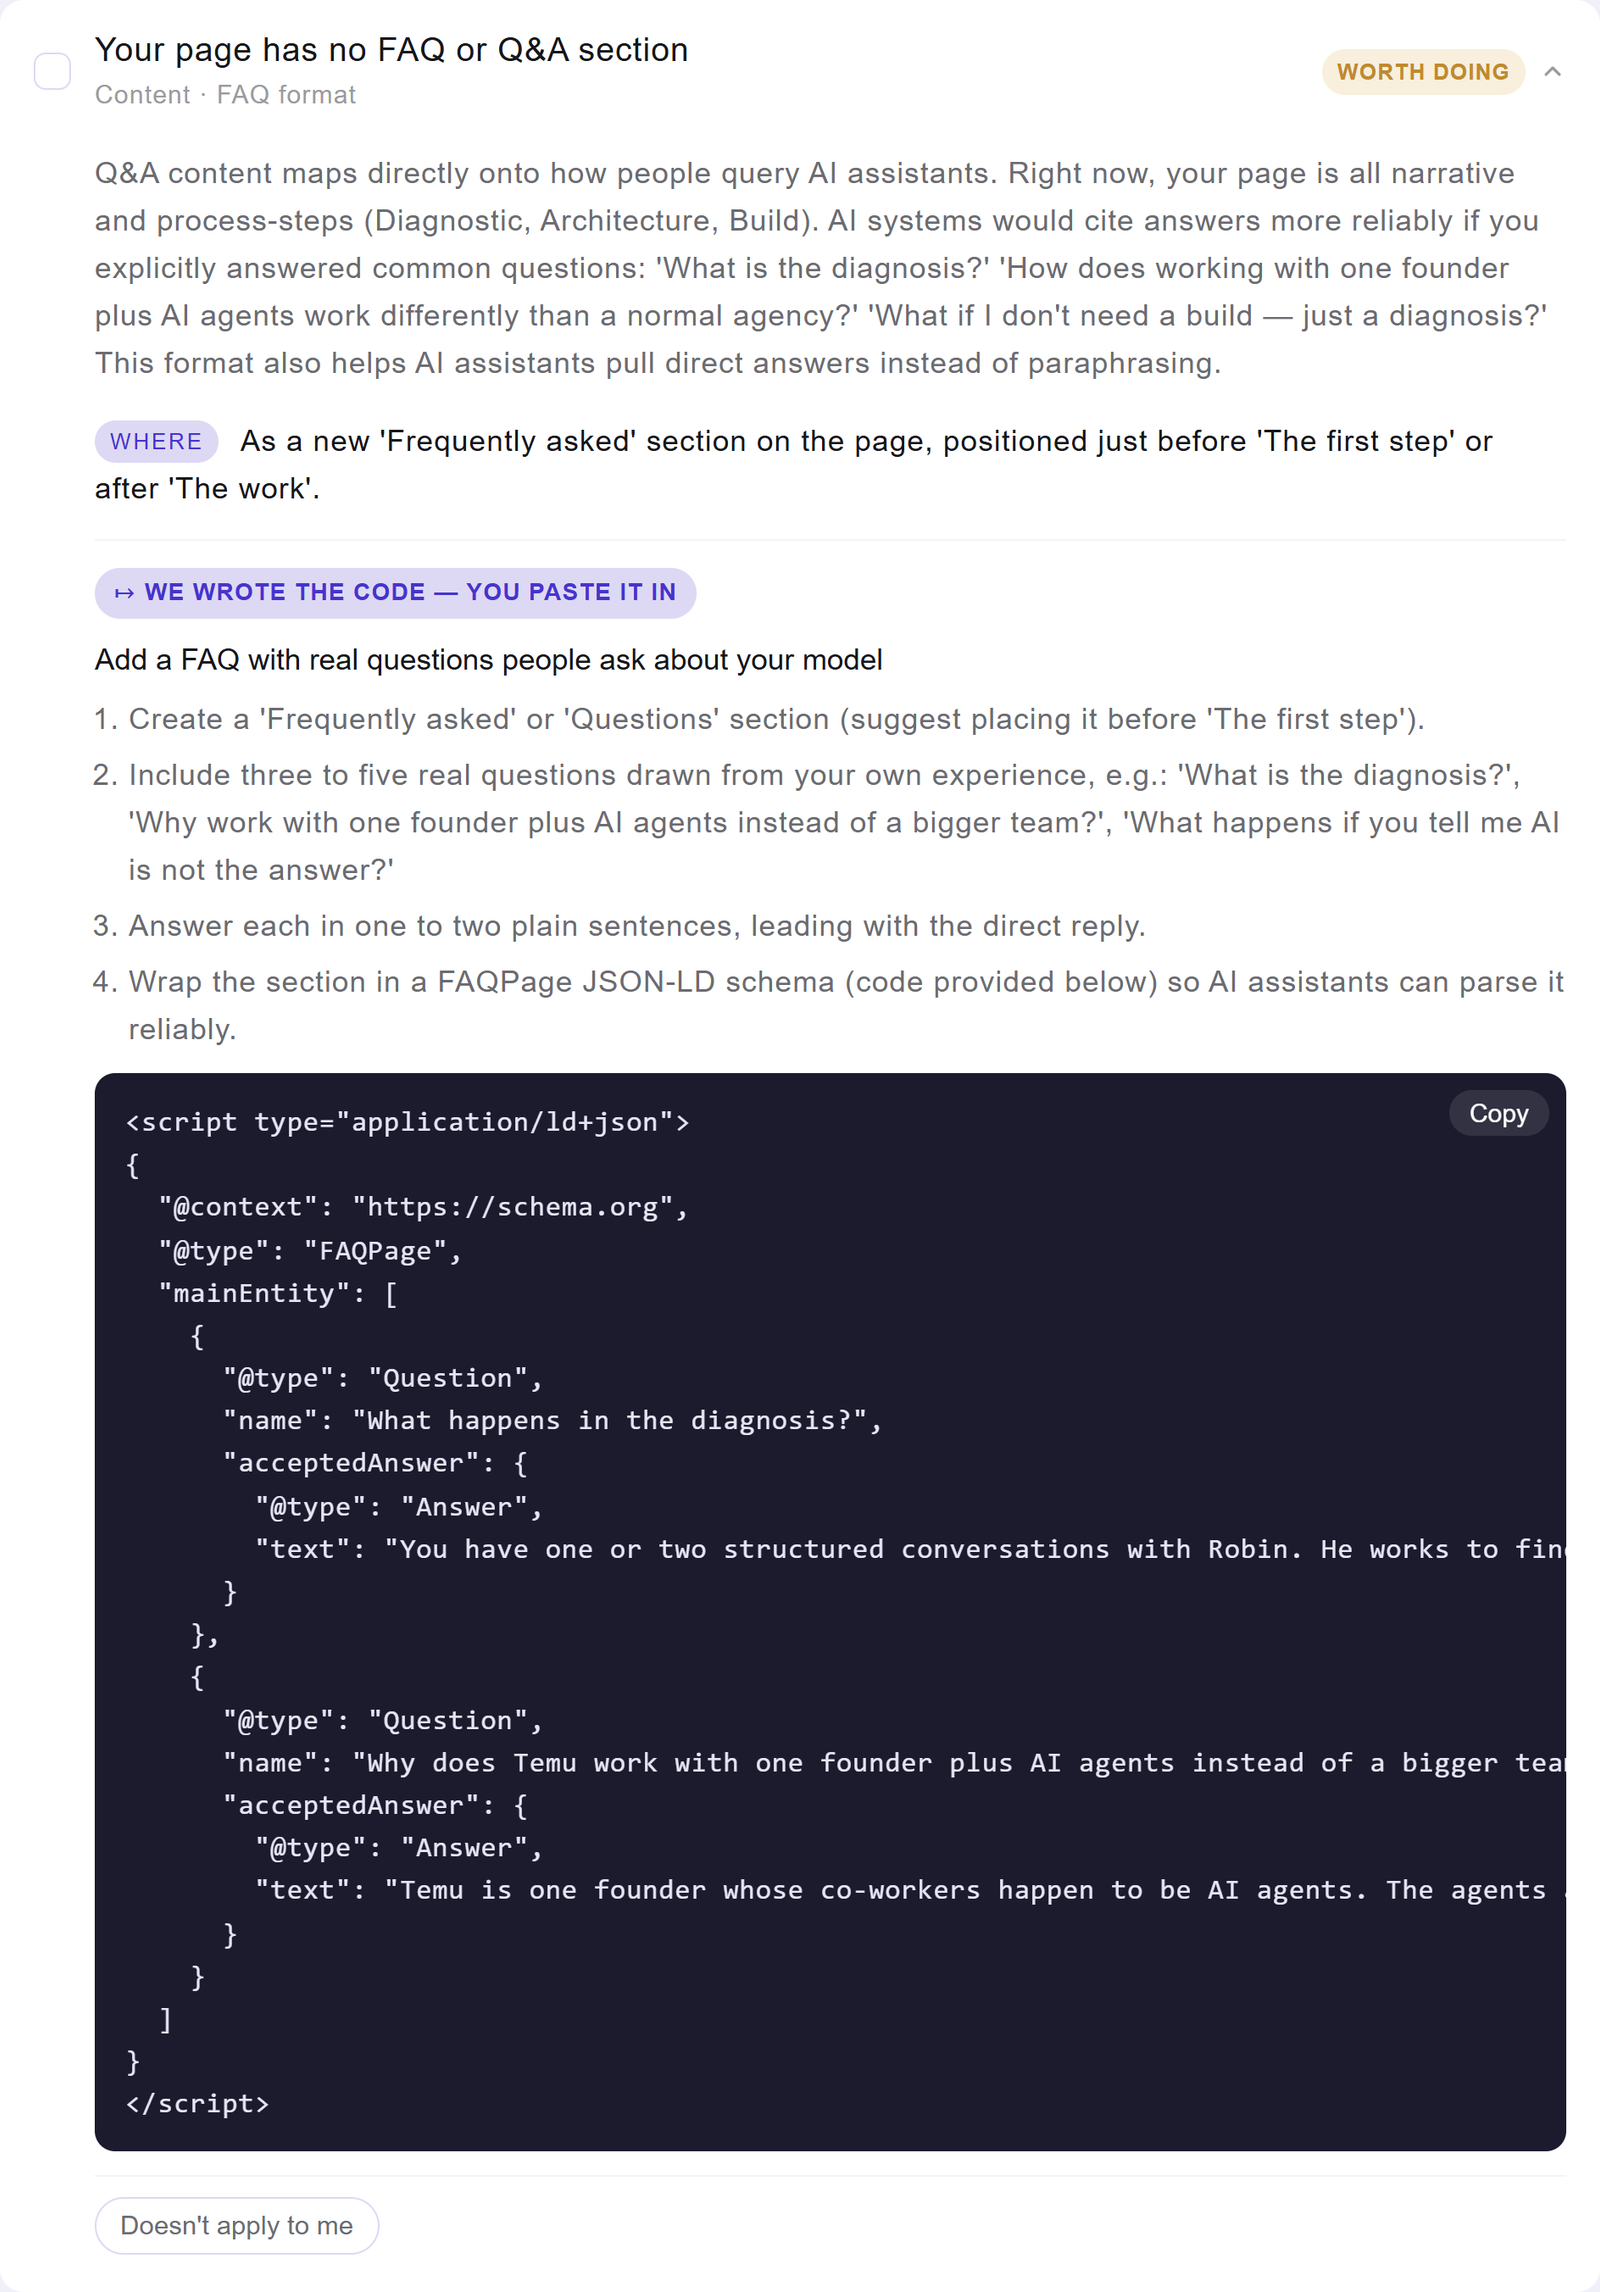
Look closely at that code block. The FAQ questions in it aren't boilerplate; Janus drafted them from what our page says we do, the way a prospective client would phrase them. Every fix on the dashboard is generated this way, from your pages, for your business. There's also a small "Doesn't apply to me" button on each finding. Press it and the item steps aside, counted as handled, reversible any time. Not every check fits every business, and the dashboard would rather admit that than nag you.
The Mirror
The last piece is our favourite, and it isn't scored at all. The Mirror takes the opening words of your homepage, quotes them back to you verbatim, and sets a rewrite beside them: your version now, and a version AI reads better.
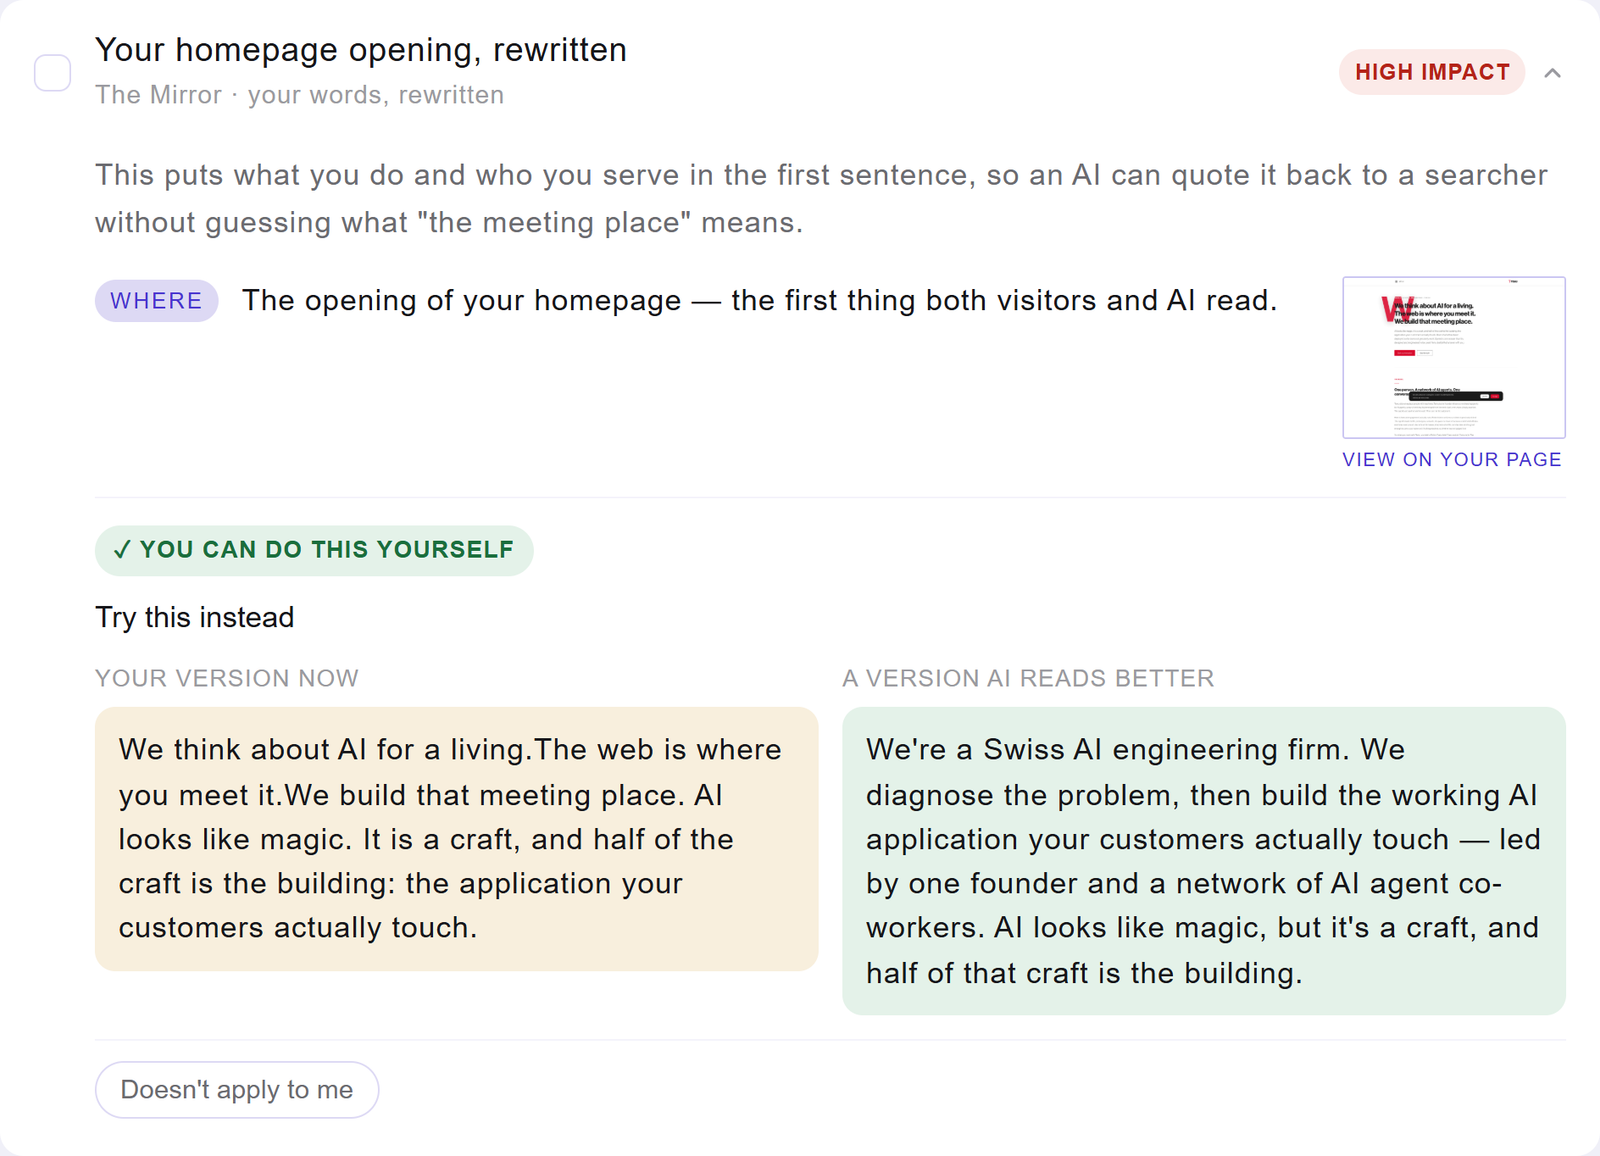
Our own homepage opens with "We think about AI for a living. The web is where you meet it." Lovely for a human, useless for a machine asked "what does this company do?". The rewrite leads with the facts: a Swiss AI engineering firm, diagnosis first, then the build. Seeing your own words next to the machine-friendly version teaches the pattern faster than any guideline document we could write, which is why the Mirror exists as a demonstration rather than a chore.
Working the list
A session with the dashboard tends to go like this. You read the Summary once, in about ten seconds, because that's what it was built for. You pick one of the three priorities, or you copy the fix brief and hand the whole thing to your developer. You check items off as you go and watch the ring fill. Tomorrow, or next week, you re-scan and see whether the number moved. The dashboard is less a report than a habit, and the habit is the point: visibility to machines is won in small, verifiable steps, and it helps to have a scorekeeper with no interest in flattering you.
Meanwhile we'll be over here dealing with our Trust score of zero. Janus has already written us the fix; the least we can do is take our own medicine. If you'd like to see what he makes of your site, the free scan at translimen.io is the door.
A word of transparency: Limen is our own product, and this walkthrough is documentation as much as it is an article. The screenshots show a real scan of our own site, temu.swiss, unretouched, including the parts that don't flatter us. AI visibility is a young discipline and the checks described here will keep evolving with it.